https://github.com/user-attachments/assets/33c921e8-39f0-47a8-9a36-4fe6679e55ca
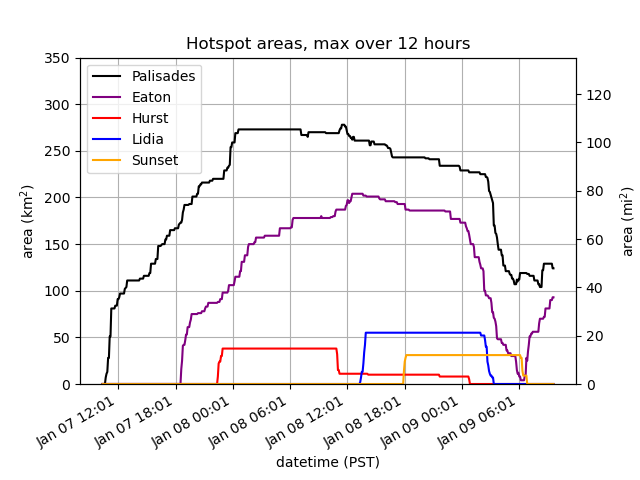
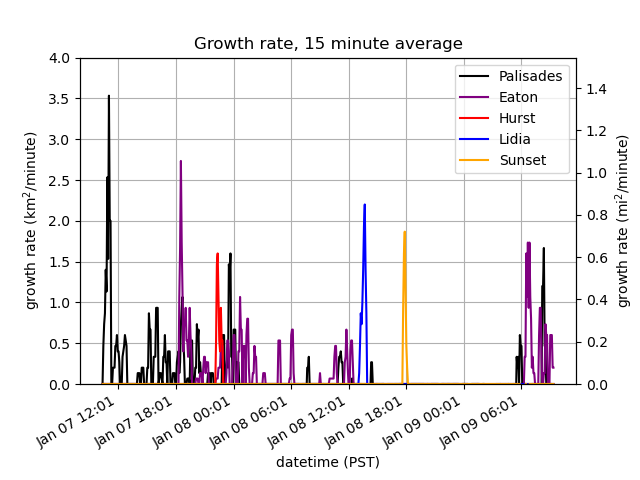
3.9 micron data from the GOES-16 East and GOES-18 West satellites on the January 2025 Southern California fires. We download the reprojected data from UW SSEC's RealEarth program. Each image is 128x128 pixels, centered at (34.1, -118.4). Each pixel is 1.0 km. The satellites measure the temperatures of the topmost infrared-opaque region in the atmosphere, which may exaggerate the extent of fires from heated smoke, or hide the extent from cloud cover. You can see how quickly the fires initially grow — up to a square mile every minute at first — fueled by dry vegetation and strong winds. This shows the extreme difficulty of containment.
The code combines the two satellites' data for increased resolution. It currently measures the areas of hotspots. If I have more time I might try doing some other measurements, but I also wrote in a hurry this to demonstrate the accessibility of citizen science.
If you want to play with the code online,
one way is to import this repository onto Google Colab.
Change the parameters of download.py to import new data,
and perform the analysis with analysis.ipynb.